The brief
Where data meets storytelling
Drinkaware is a charity that gives people practical and helpful advice for drinking alcohol safely. Their work is broad, from direct work with alcohol brands to resources for the general public.
Each year, the charity produces a report that tracks alcohol consumption and habits in the UK. This work falls under the umbrella of the Monitor. This report is a good indicator on whether attitudes and behaviours around alcohol are changing. This knowledge and insight is helpful in understanding broad changes and their potential impact.
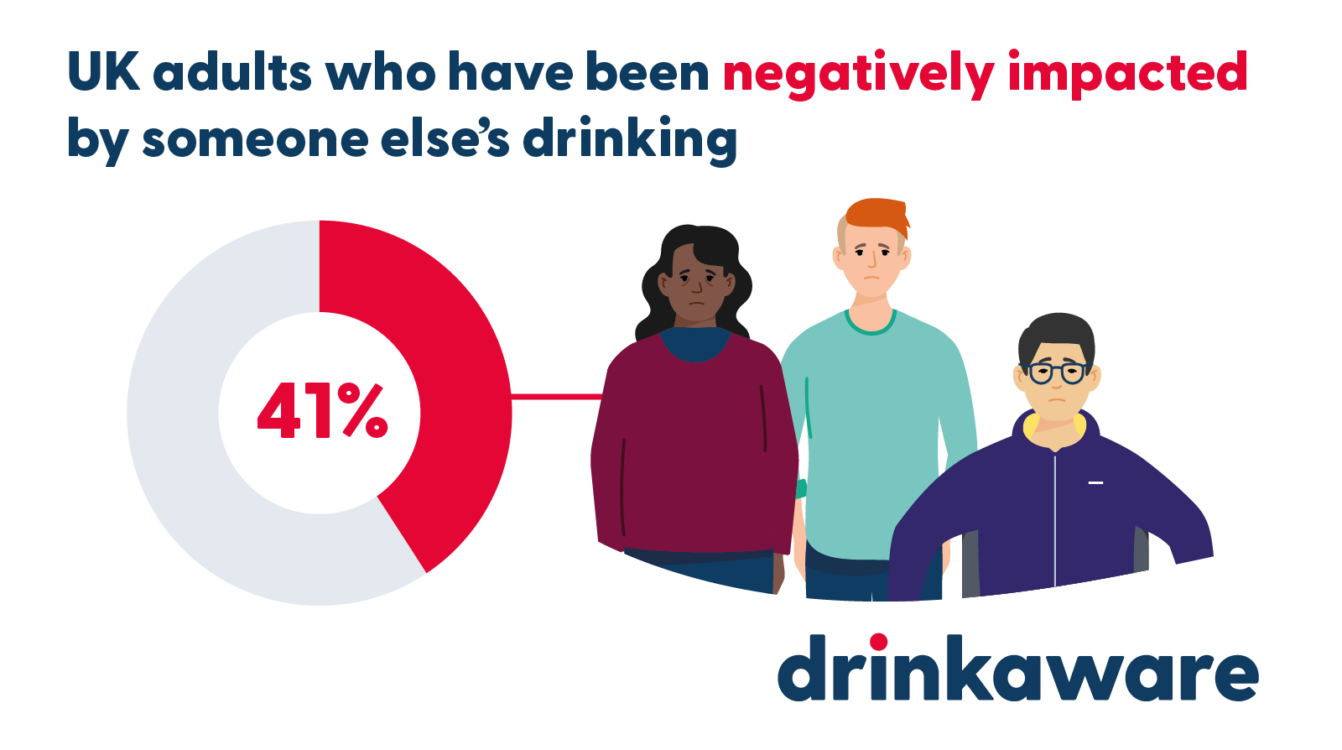
Breaking this report down and making it as accessible as possible is important. As part of that, Drinkaware asked us to create a series of infographics. These needed to be reflective of their findings, but also anonymously share real lived experience. These assets had to be easy to understand, engaging and on brand for the charity.
What we did
First thing’s first; the data. We had to have a good understanding of the findings, what they meant and how they impacted our story. Contained within this data were real experiences, which would be used as the basis for the animations. It wasn’t just a case of finding out more about this topic, we also had to see what would work best for the infographics we were going to create. Too little information and they wouldn’t be useful, too much and they’d become overwhelming.
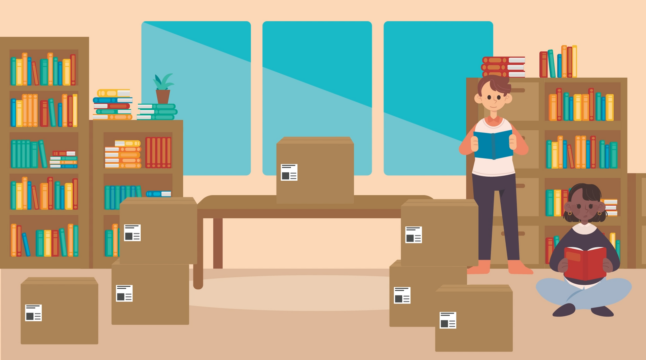
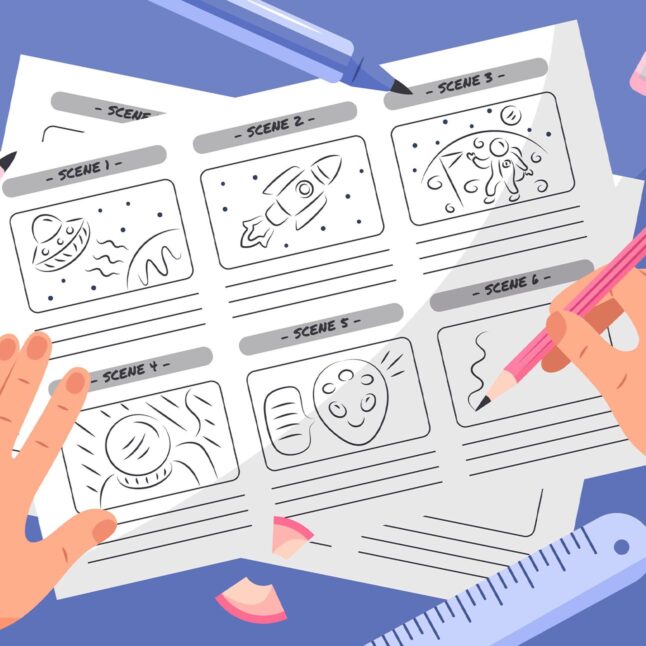
Data appraised, we moved onto the pre-production proper. Part of the team focussed on the story. We took the lived experience shared with us and turned these into scripts. Our illustration and animation team worked on the assets needed to create the infographics and animations. This entailed working with some existing assets, but mostly creating all new material to work with.
The assets created were used to create 13 artboards, a unified .PDF document and 3 case study animations.


The technical
Concept development
Schedules and timelines
Style development
Draft layouts
Asset creation
Infographic creation
Animation
Music Licensing
Subtitling
The result
Data informed storytelling
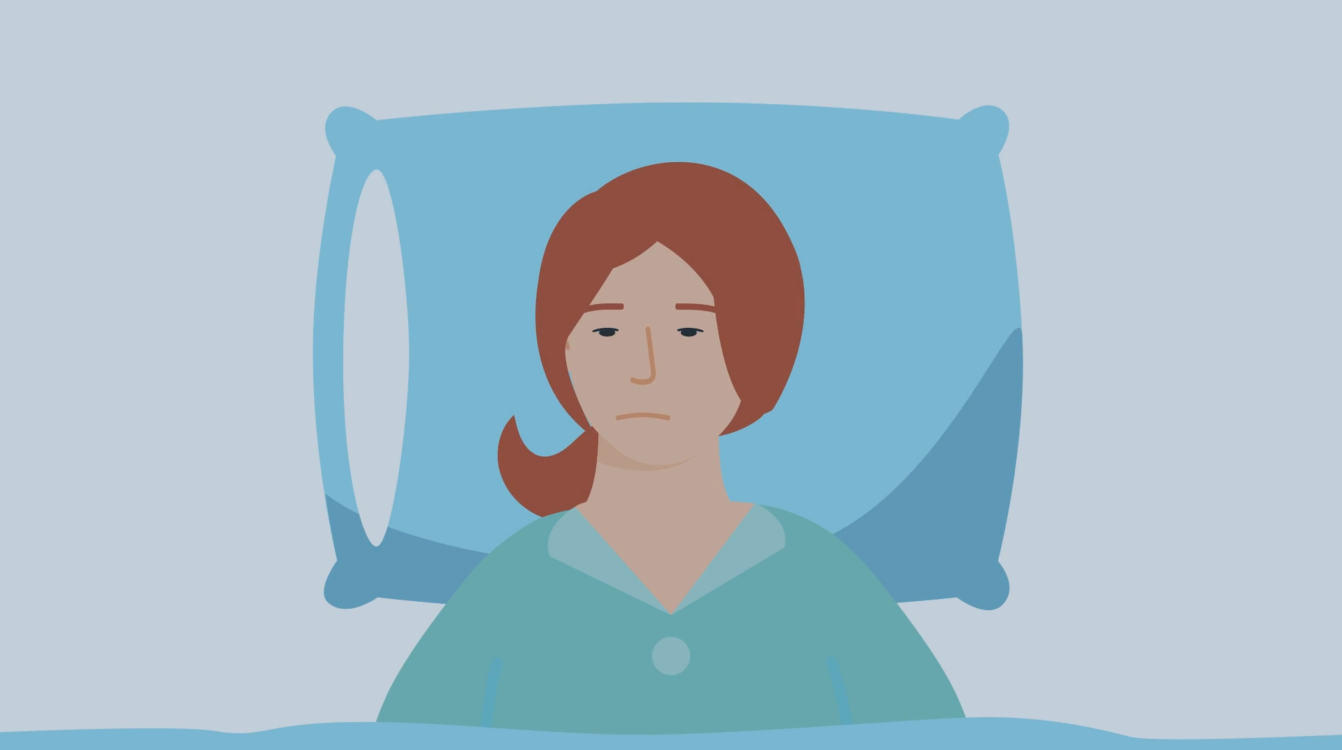
What is data? It’s the reflection of people’s lives and experiences. The goal with this project was to share experiences and to give people easily accessible knowledge. We were able to do this, creating resources that were central to 2022’s monitor. The animation and infographics creatively shared important information and compassionately told stories of traumatising experiences connected to alcohol consumption.